Emily Qiu

Master of Analytics | UC Berkeley
BSc in Applied Mathematics (Hons) | University of Edinburgh
About
Hi, I’m Emily — a data scientist and machine learning engineer with a Master of Analytics from UC Berkeley and a BSc in Applied Mathematics with Honours from the University of Edinburgh. My work combines statistical modeling, machine learning, analytics engineering, and product-oriented problem solving.
I’m especially interested in building data and ML systems that move beyond notebooks: production APIs, monitoring dashboards, recommendation systems, causal analysis workflows, SQL analytics platforms, and decision-support tools. My projects span machine learning engineering, agent systems, BI, forecasting, experimentation, and operational analytics.
I approach problems with both mathematical rigor and practical engineering judgment. I care about clean assumptions, reproducible workflows, explainable results, and interfaces that help technical and non-technical users make better decisions.
This portfolio showcases my growth across data science, machine learning engineering, analytics, and full-stack data products — with an emphasis on projects that are useful, testable, and close to real-world production patterns.
Table of Contents
- About
- Portfolio Projects
- Python
- MATLAB
- SQL
- R
- Excel / Google Sheets
- Tableau
- Power BI
- Certificates
- Contact
Portfolio Projects
Agent Engineering Systems
Code: Agent Engineering Systems
Goal: To build a portfolio-grade suite of agent engineering systems that demonstrates reliable tool use, stateful execution, workflow orchestration, MCP integration, security guardrails, evaluation, observability, training data construction, reinforcement learning simulation, and research benchmarking.
Description: This project consists of ten self-contained Python systems that progress from a minimal agent loop to production and research-oriented agent infrastructure. The suite starts with a tool-calling agent that validates model-generated arguments, executes calculator, SQL, document search, time, and write tools, and records retries, permissions, and tool traces. It then extends into a stateful research agent with context engineering, structured task state, cross-session memory, checkpoint resume, evidence storage, and cited report generation.
The orchestration layer demonstrates how production agent systems combine deterministic workflows with dynamic decision nodes. It includes router, planner-executor, supervisor-worker, generator-critic, handoff, blackboard state, parallel execution, human approval, and global termination controls. A custom industrial MCP-style server exposes inspection tools, resources, and prompts through JSON-RPC-style messages, with schema validation, role/scope authorization, audit logs, two-phase write approval, and local stdio transport.
The production and reliability components implement an agent runtime with API gateway, queue, state store, memory store, artifact store, tracing service, approval service, evaluation service, timeout handling, retry with backoff, circuit breaker, bulkhead isolation, dead-letter queue, idempotency, graceful degradation, model fallback, tool fallback, partial result handling, and cost-per-success metrics. The security project adds prompt injection detection, tenant isolation, resource scoping, SQL allowlists, shell/network sandboxing, PII and secret redaction, dry-run mode, kill switch, approval gates, and final-answer guardrails.
The advanced and research modules demonstrate hierarchical planning, dependency graphs, critical path analysis, search-based planning, dynamic replanning, verifier-guided reflection, persistent workspace management, multi-agent coordination, trajectory collection, tool-call SFT data generation, negative trajectory construction, reward shaping, offline RL simulation, controlled benchmarks, ablation studies, confidence intervals, contamination checks, and scaffold-vs-base-model gain analysis.
Skills: Agent architecture, tool calling, context engineering, state/session/memory design, workflow orchestration, MCP-style integration, JSON-RPC, schema validation, security guardrails, RBAC, audit logging, approval workflows, observability, reliability engineering, regression evaluation, trajectory analysis, reward design, research benchmarking.
Technology: Python, dataclasses, Pydantic, SQLite, JSON Schema-style validation, JSON-RPC-style transport, local vLLM-compatible client integration, deterministic simulation, CLI tooling, self-test harnesses.
Results:
- Built a ten-project agent engineering suite with each module runnable independently through
--self-test. - Implemented production safety boundaries that prevent unauthorized reads, production deletion, arbitrary SQL, arbitrary shell execution, secret leakage, and approval bypass.
- Created an MCP-style industrial inspection server exposing
query_defects,get_panel_summary,get_cad_alignment,run_rca,get_model_metrics, andcreate_retrain_requestwith read/write separation and two-phase approval. - Added evaluation infrastructure covering task success, answer correctness, groundedness, completeness, format compliance, tool selection, argument accuracy, trajectory safety, p50/p95/p99 latency, token usage, retry/timeout rates, human intervention rate, and cost per success.
- Demonstrated production runtime patterns including queueing, checkpoints, artifact persistence, trace events, model/tool fallback, circuit breakers, bulkheads, idempotency, dead-letter handling, and graceful partial-result completion.
- Included research-oriented infrastructure for controlled benchmarks, ablations, confidence intervals, hidden test cases, contamination checks, and separation of model capability from scaffold gains.
Full-Stack ML Risk Platform
Backend: Production ML Risk Scoring API
Frontend: ML Operations Monitoring Dashboard
Goal: To build a production-style full-stack machine learning platform with a FastAPI backend for real-time transaction risk scoring and a React frontend for ML operations monitoring.
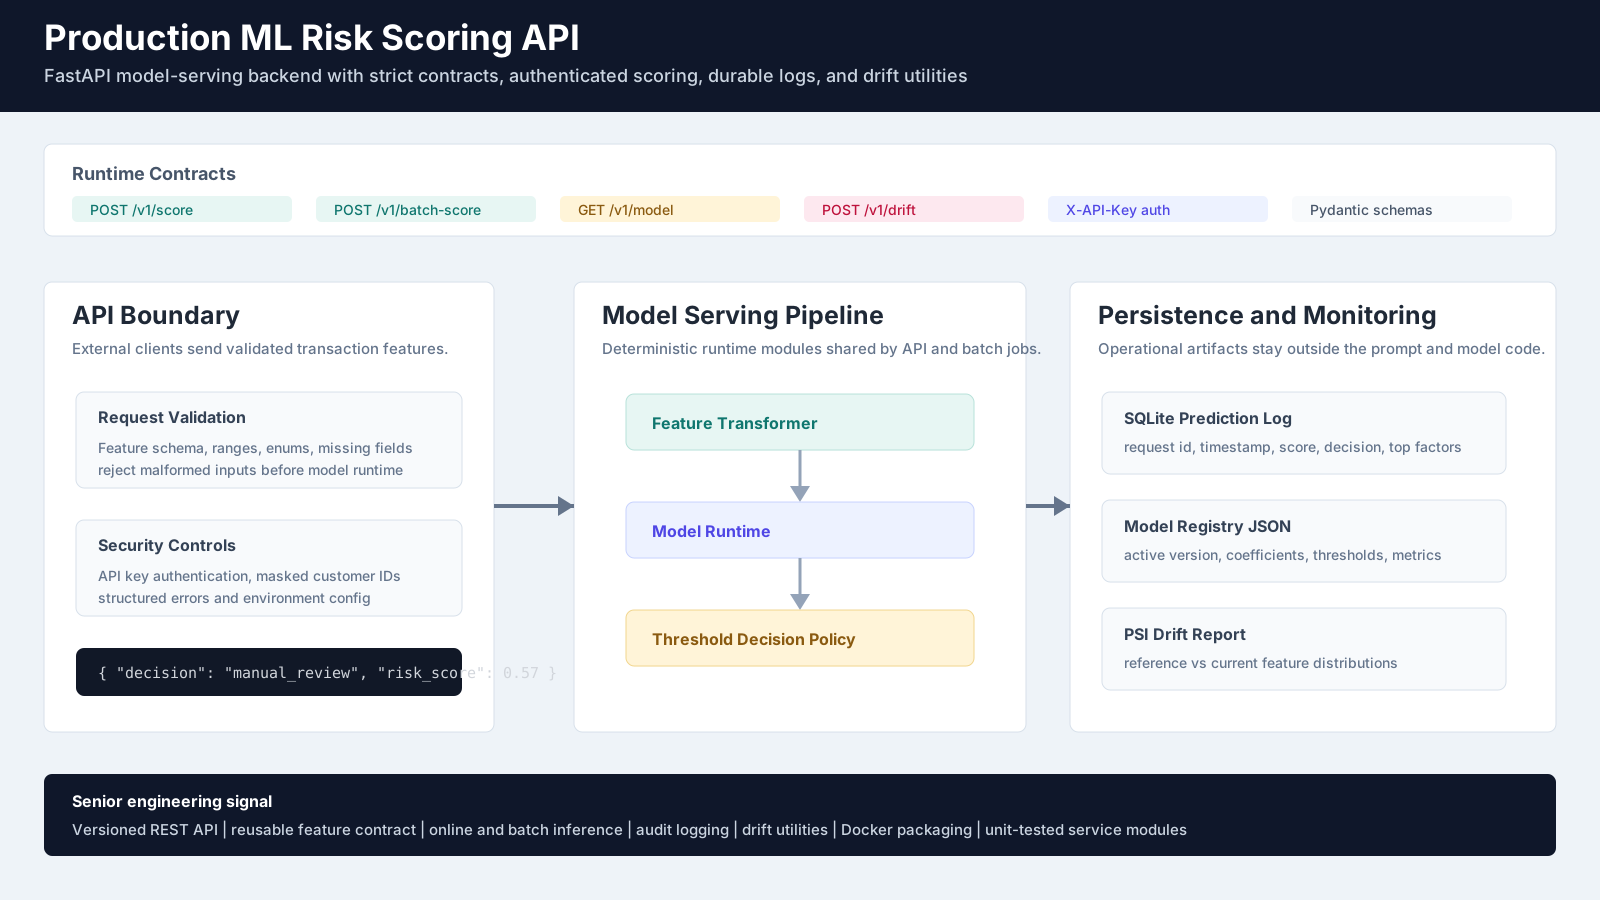
System Overview: This platform is intentionally split into two portfolio projects with clear ownership boundaries. The backend owns model serving, feature contracts, authentication, prediction logging, model registry metadata, drift utilities, batch scoring, Docker packaging, and tests. The frontend owns the monitoring user experience, KPI panels, prediction audit trail, feature drift views, model registry display, and live scoring probe.
Together, the projects show the full path from model artifact to production API to operational monitoring surface, which is closer to how ML products are built in real teams than a single notebook or isolated dashboard.
Backend: Production ML Risk Scoring API
Code: Production ML Risk Scoring API
Goal: To build a production-style machine learning backend that serves real-time transaction risk scores, supports batch scoring, logs predictions for auditability, exposes model registry metadata, and includes drift monitoring patterns.
Description: This project turns a model artifact into a reliable backend service. It includes a FastAPI application with versioned online and batch scoring endpoints, Pydantic request and response schemas, a deterministic model registry, reusable feature transformation, approve/manual-review/decline decision policy, API key authentication, prediction logging with masked customer identifiers, and a batch scoring CLI.
The project is structured like a production MLE service rather than a notebook. The model artifact is stored separately from code, the same feature contract is shared by API and batch workflows, prediction logs are persisted for monitoring and delayed-label joins, and drift monitoring utilities use Population Stability Index. This project owns the backend contracts, model runtime, persistence, and deployment shape; the separate monitoring dashboard project owns the frontend operations surface. The repository also includes Docker packaging, environment configuration, API documentation, monitoring notes, deployment guidance, model card documentation, and tests.
Skills: Machine learning engineering, FastAPI backend development, model serving, Pydantic validation, feature engineering, model registry design, prediction logging, batch inference, drift monitoring, API authentication, Docker packaging, testable service architecture.
Technology: Python, FastAPI, Pydantic, SQLite, Docker, Docker Compose, pytest-compatible tests, deterministic model artifacts, REST API design.
Results:
- Built a versioned real-time risk scoring API with strict feature validation and response contracts.
- Implemented online scoring, batch scoring, model metadata loading, decision thresholds, and top-factor explanations.
- Added masked prediction logging for auditability, monitoring, and delayed-label evaluation workflows.
- Added drift monitoring utilities, Docker deployment assets, API documentation, model card, and unit tests.
- Verified Python compilation, core tests, and batch scoring smoke test locally.
Frontend: ML Operations Monitoring Dashboard
Code: ML Operations Monitoring Dashboard
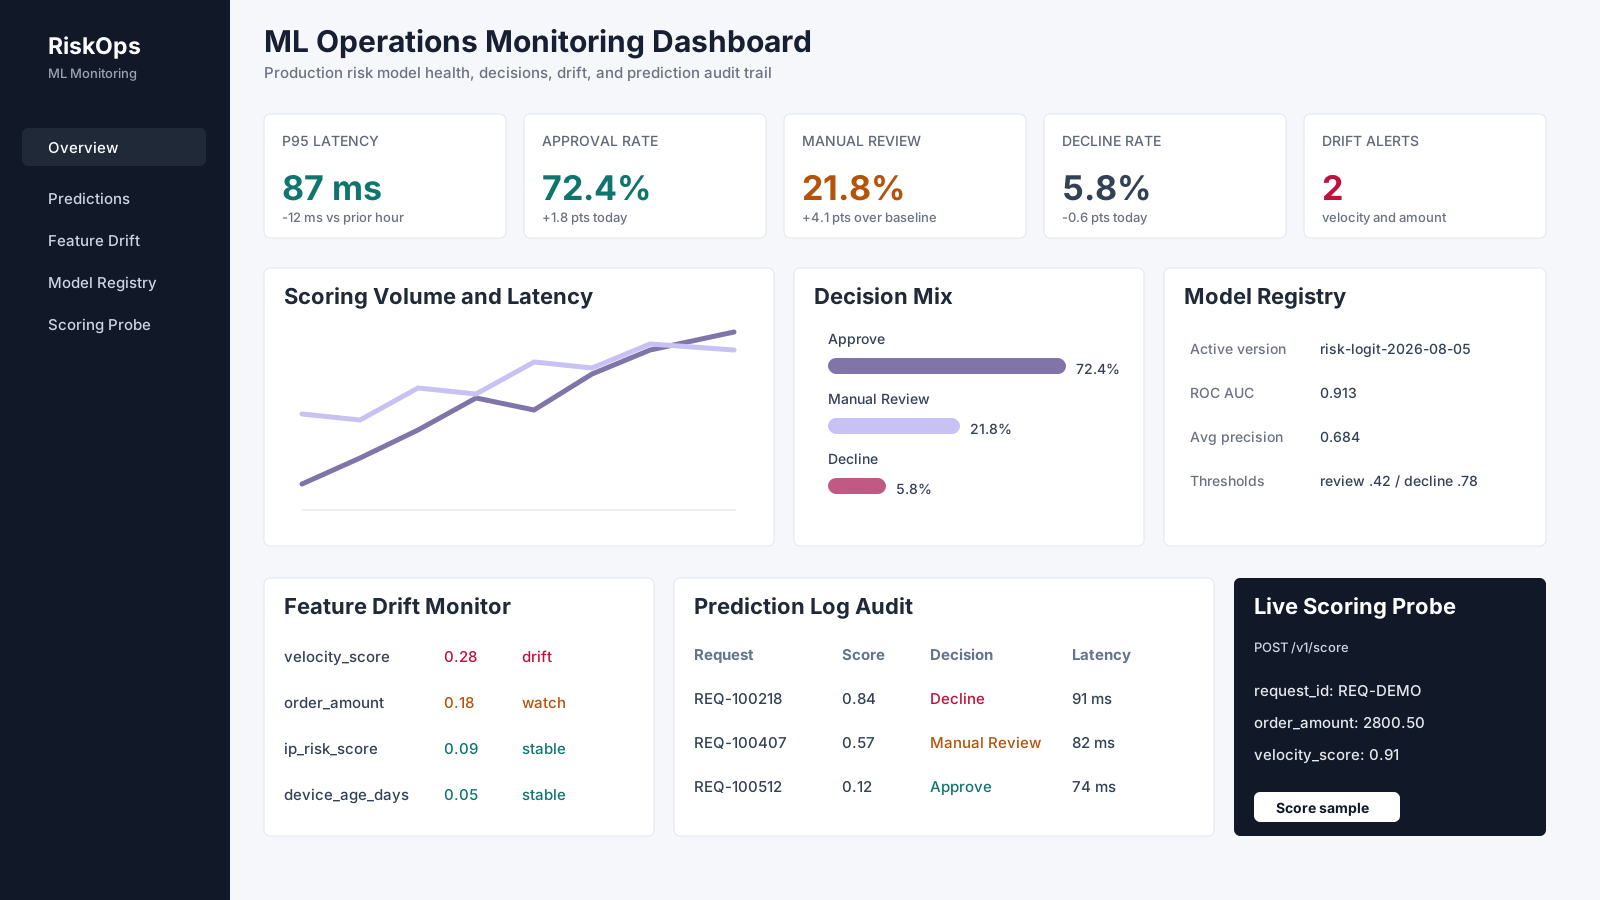
Goal: To build a frontend monitoring dashboard for the Production ML Risk Scoring API, covering model health, scoring volume, latency, decision distribution, feature drift, prediction audit logs, model registry metadata, and a live scoring probe.
Description: This project is the frontend companion to the production ML backend. It uses React, TypeScript, and Vite to create a product-style monitoring surface for machine learning operations. The dashboard includes KPI cards, an SVG request-volume and latency chart, decision mix visualization, feature drift table, prediction audit log, model registry panel, and a live scoring console that can call the FastAPI /v1/score endpoint.
The interface is designed for ML platform engineers, risk operations leads, and data scientists who need to monitor model behavior after deployment. It runs independently with mock monitoring data, while also supporting local backend integration through environment variables for the risk scoring API base URL and API key.
Skills: React, TypeScript, frontend architecture, API integration, operational dashboard design, ML monitoring UX, responsive layout, SVG data visualization, component design, product requirements.
Technology: React, TypeScript, Vite, CSS Grid, SVG charts, lucide-react, REST API integration.
Results:
- Built a responsive ML monitoring dashboard with production-style operational panels.
- Integrated a live scoring probe for the FastAPI risk scoring backend.
- Implemented reusable components for KPIs, trends, decision mix, drift monitoring, prediction logs, and model registry metadata.
- Added architecture notes, API integration documentation, and product requirements.
- Verified the app with
npm installandnpm run build.
Reinforcement Learning Dynamic Pricing Lab
Code: Reinforcement Learning Dynamic Pricing Lab
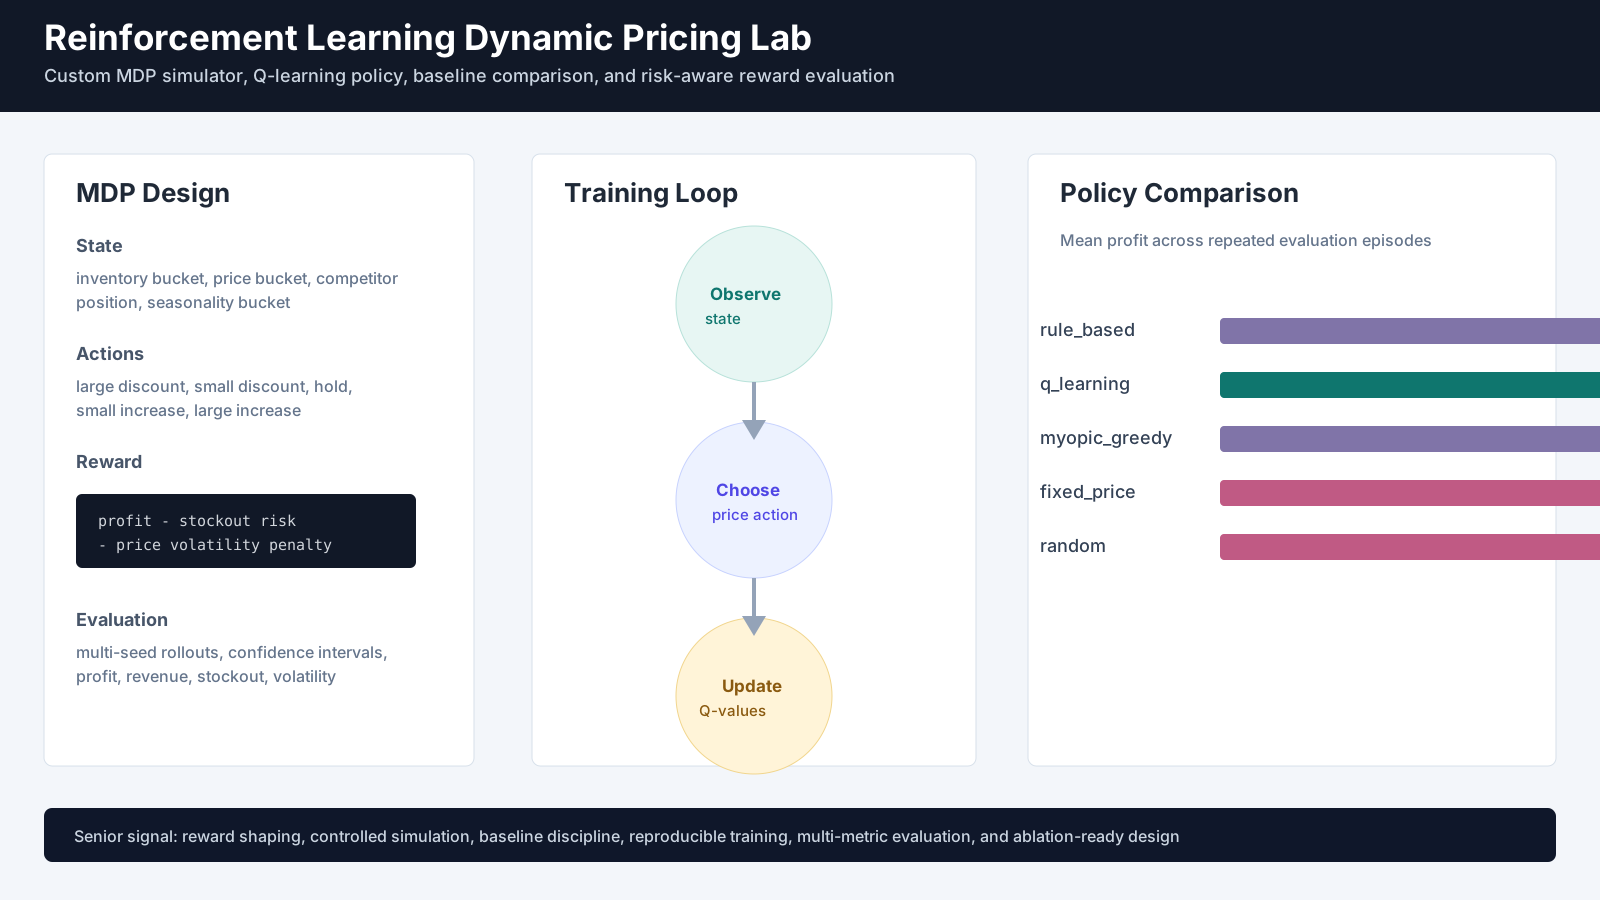
Goal: To build a reproducible reinforcement learning lab for dynamic pricing, where a pricing agent learns to balance long-term profit, demand uncertainty, competitor pricing, inventory pacing, stockout risk, and price volatility.
Description: This project frames pricing as a finite-horizon Markov decision process rather than a one-step prediction problem. The custom environment exposes a discrete state made from inventory bucket, price bucket, competitor-price position, seasonality bucket, and selling-horizon bucket. The action space covers large discount, small discount, hold, small increase, and large increase.
The reward function is business-aware: it rewards gross profit while penalizing stockouts, low inventory, early inventory depletion, and excessive price movement. The project compares fixed price, random, rule-based, myopic greedy, and tabular Q-learning policies across repeated seeds. Evaluation reports mean reward, gross profit, revenue, stockout rate, price volatility, final inventory, and 95% confidence intervals.
Skills: Reinforcement learning, Markov decision processes, reward shaping, dynamic pricing, simulation, tabular Q-learning, baseline policy design, constrained decision-making, confidence intervals, experiment reproducibility, business metric tradeoff analysis.
Technology: Python, dataclasses, custom simulation environment, tabular Q-learning, SVG artifact generation, CSV evaluation outputs, pytest-compatible tests.
Results:
- Built a custom dynamic pricing MDP with state, action, transition, reward, and terminal logic.
- Implemented baseline policies and a Q-learning policy with epsilon-greedy exploration and conservative pricing guardrails.
- Generated reproducible experiment artifacts including policy comparison CSV, training curve, learned policy heatmap, and portfolio preview.
- Evaluated policies across repeated random seeds with profit, reward, stockout, volatility, inventory, and confidence interval metrics.
- Verified Python compilation and unit tests for environment transitions, baseline actions, and learned policy evaluation.
Online Influencer Product Recommendation System
Code: Online Influencer Product Recommendation System
Final Presentation: Presentation
Goal: To develop a multi-stage, data-driven product recommendation system for social media influencers, aimed at maximizing engagement and sales potential through personalized product placements.
Description: This project focused on building a full-stack recommendation engine that identifies and ranks suitable Amazon products for social media influencers based on audience engagement, influencer profile, and market trends. The system integrates multiple machine learning techniques across three main stages:
1) Recall Stage:
Utilized influencer-based collaborative filtering by computing caption similarity (TF-IDF + cosine similarity) and follower overlap via KNN (k=11) to identify a pool of relevant products. Historical influencer engagement and popularity trends were also incorporated to ensure diversity and completeness of the candidate set.
2) Fine Ranking Stage:
Relevance scores were computed using a hybrid scoring model:
$\text{Score}_{\text{user, product}} = \alpha \times \text{Predicted Likes} + \beta \times \text{Collaborative Filtering Score} + \gamma \times \text{User-Product Embedding Similarity}$
A LightGBM model was trained on multi-dimensional features (influencer attributes, product metadata, timing) to predict post engagement (likes/comments), achieving an $R^2 = 0.507$.
4) Re-Ranking Stage:
Applied SBERT embeddings and FAISS for fast similarity search between influencer captions and product descriptions. An autoencoder architecture learned a shared latent space for aligning influencers’ post embeddings with product metadata vectors, enabling efficient top-N product recommendations.
Skills: Collaborative filtering, content-based recommendation, supervised learning (LightGBM), feature engineering, embedding models (SBERT), autoencoders, model evaluation, Streamlit UI development.
Technology: Python (scikit-learn, LightGBM, PyTorch, FAISS, NLTK), SBERT, PCA, Streamlit, Amazon Reviews dataset, Instagram API.
Results:
- The LightGBM engagement model demonstrated strong predictive accuracy for likes based on influencer behavior and posting time.
- Recommender favored fashion and entertainment products, while identifying high engagement potential in underrepresented categories like health and personal care.
- Influencer engagement patterns showed optimal post timing around late evenings and Mondays.
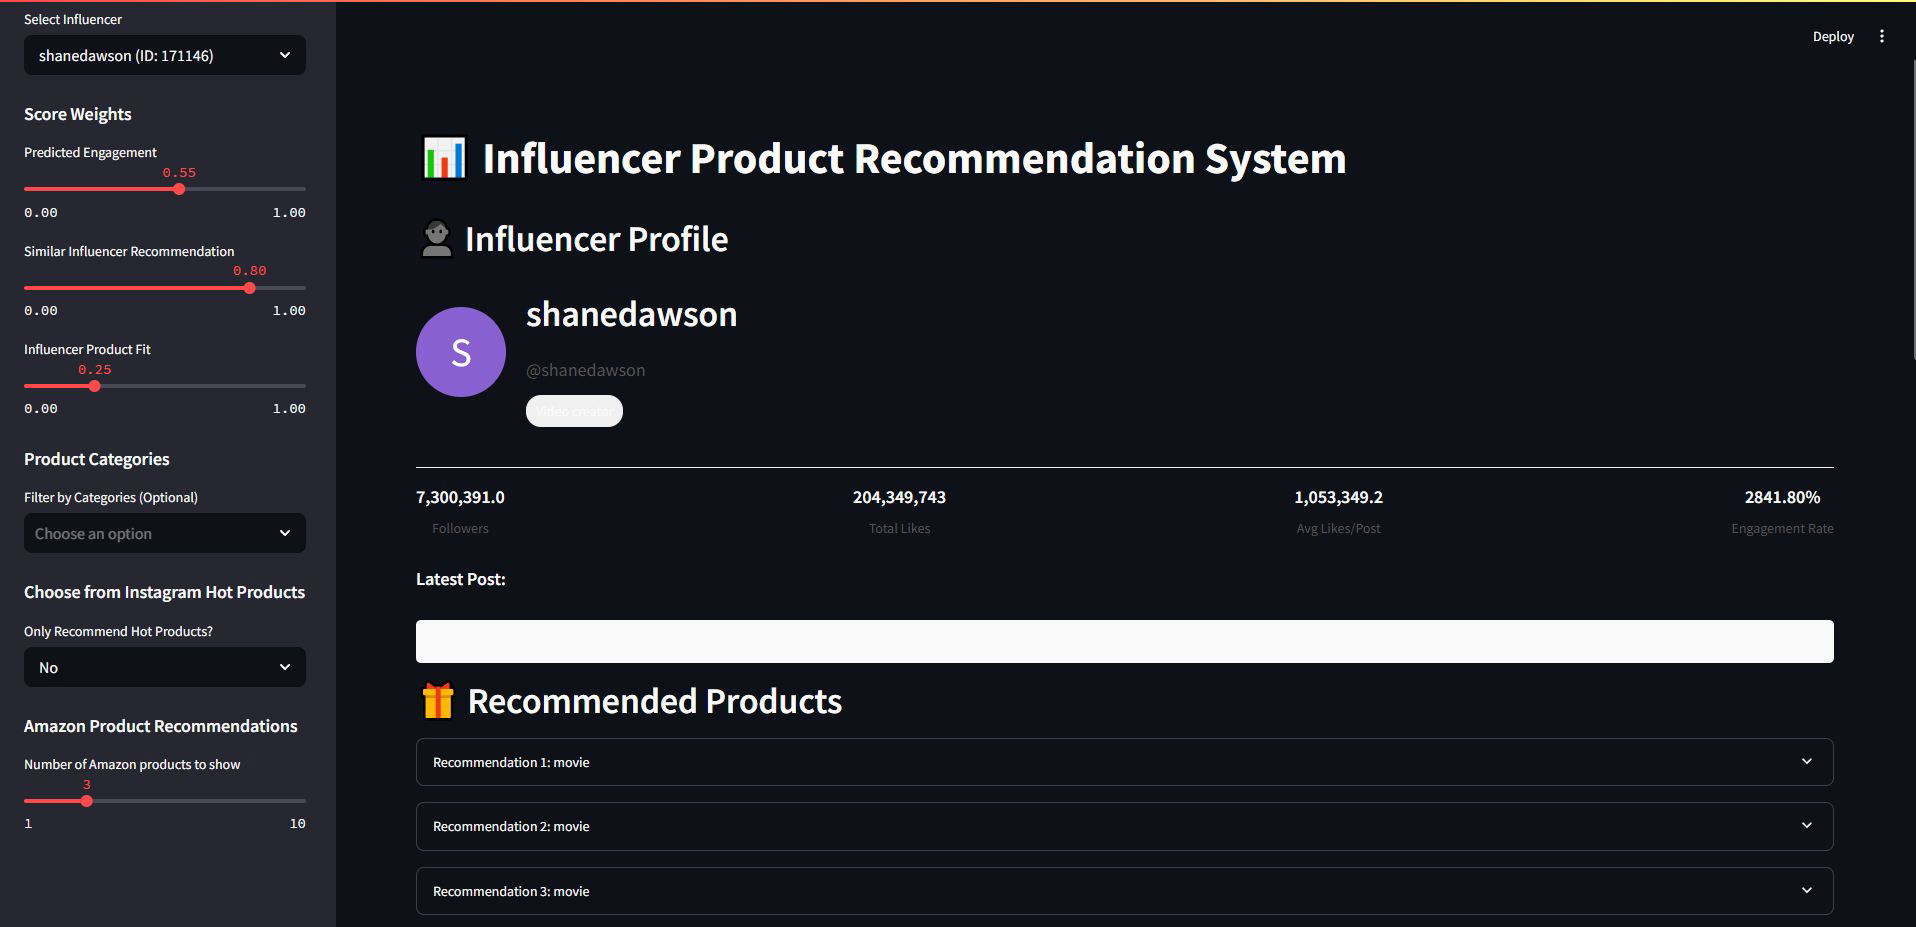
- A prototype dashboard built in Streamlit allowed influencers to customize recommendation weights and receive predicted likes, category fit, and best posting time.
This system highlights end-to-end ML pipeline design, integration of structured and unstructured data, and real-world applicability in influencer marketing and recommendation systems.
Calyber: A Shared Rides Pricing and Matching Game
Code: Calyber Game
Report: Calyber_Final_Report.pdf
Goal: To develop a scalable, profit-aware, and computationally efficient joint pricing and ride-matching policy for a simulated ride-hailing platform using real-world data.
Description: This project tackled the dual challenge of dynamic pricing and real-time rider matching within the Calyber shared mobility platform. Leveraging historical ride data from Chicago, the team engineered a contextual multi-armed bandit algorithm and a profit-maximizing greedy matcher to simulate intelligent dispatch behavior.
The pricing policy used a contextual Beta-Bernoulli Thompson sampling bandit, trained offline, to learn rider price sensitivity across origin-destination pairs, pool sizes, and wait-time buckets. The model balanced exploration and exploitation under uncertainty, enabling adaptive, interpretable pricing within sub-5ms runtime limits.
On the matching side, a marginal-gain greedy algorithm was implemented. It assessed every new rider’s incremental profit potential with existing waiting riders and executed matches only when doing so improved overall system profit. This ensured matches were not only feasible but also financially optimal.
Skills: Bayesian machine learning, simulation modeling, dynamic pricing, real-time decision-making, matching algorithms, performance benchmarking.
Technology: Python (NumPy, pandas, scikit-learn), simulation frameworks, Git.
Results:
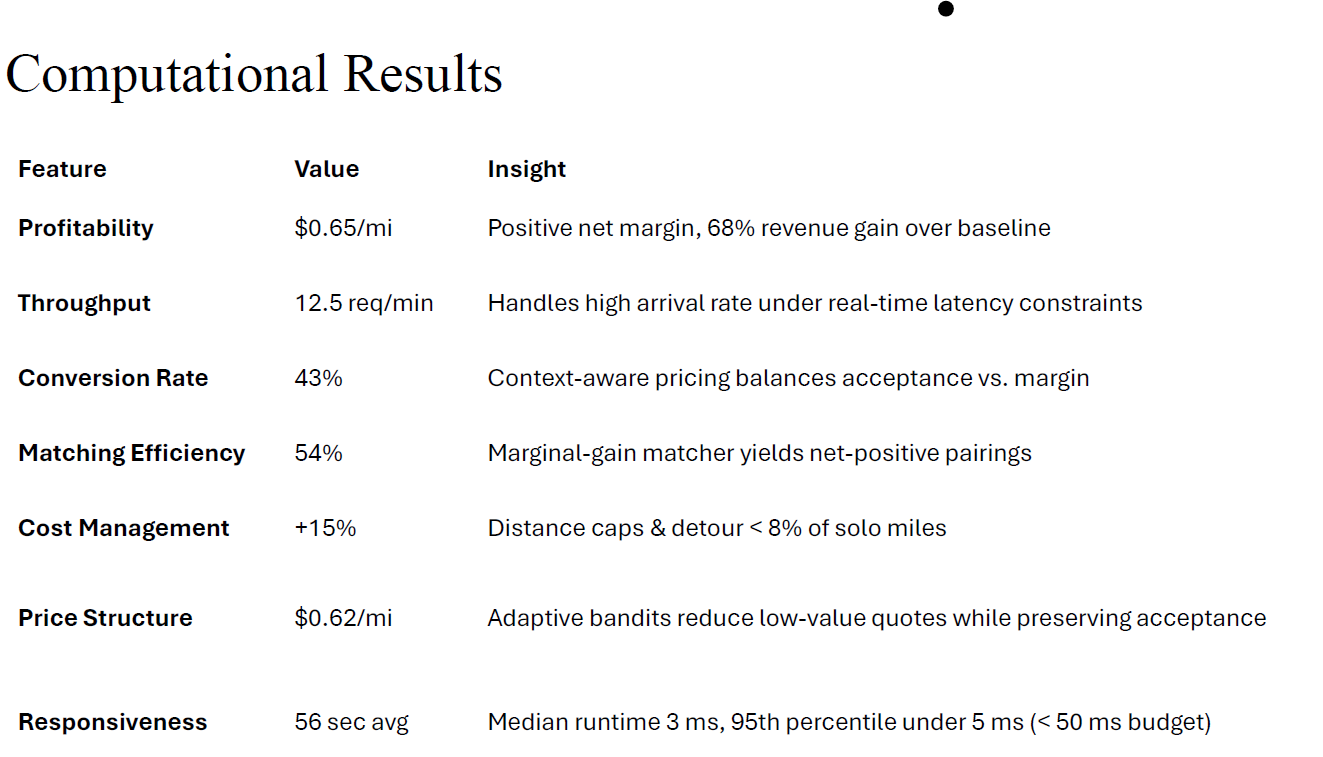
- Achieved a $0.65/mi net profit, up from a negative baseline.
- Reached a 43% rider conversion rate, demonstrating effective pricing.
- 54% match rate with high cost-efficiency (detours under 8% of solo miles).
- Runtime latency kept under 5ms per decision, meeting real-time constraints.
This project demonstrates the real-world application of ML algorithms for supply chain and transportation optimization, blending statistical modeling with computational performance for deployment-ready solutions.
The Traveling Salesman Problem (TSP)
Code: The Traveling Salesman Problem
Report: TSP_Project_Report.pdf
Goal: To assess various algorithmic strategies against the TSPLIB dataset to identify the most effective approaches for symmetric TSP instances.
Description: The project implemented a branch and bound algorithm for solving the Traveling Salesman Problem (TSP) using Python 3.10 and IBM’s CPLEX version 22.1.1.0. The DOcplex API facilitates communication between our code and CPLEX, leveraging callbacks to interact during the algorithm’s execution.
Cutting plane techniques, including sub-tour elimination constraints (SECs) and 2-matching inequalities, were implemented to handle fractional solutions. Integer Programming (IP) gap monitoring guided termination by tracking the difference between the incumbent solution and the lower bound.
Heuristic algorithms were implemented in two ways: 1) Full construction at root node (warm-start) – construct a feasible solution from scratch when no incumbent solution has yet been identified; 2) Refinement of a current solution: create integer solutions from fractional solutions or refine current integer solutions.
Nearest Neighbour and two-opt algorithms were selected for heuristic application, complemented by optional algorithms: Constuctions (cheapest insertion, farthest insertion, random insertion, greedy algorithm, nearest insertion, nearest neighbor), improvements (2-opt, 3-opt).
The approach emphasized systematic node exploration and pruning to efficiently converge to optimal TSP solutions, ensuring a robust and efficient solution process integrating advanced branch and cut techniques with heuristic methods.
Skills: linear programming, data handling and manipulation, optimization techniques, algorithm development and optimization, statistical analysis, heuristic methods, performance monitoring, computation efficiency, software integration.
Technology: Python (Numpy, Matplotlib, cplex, docplex).
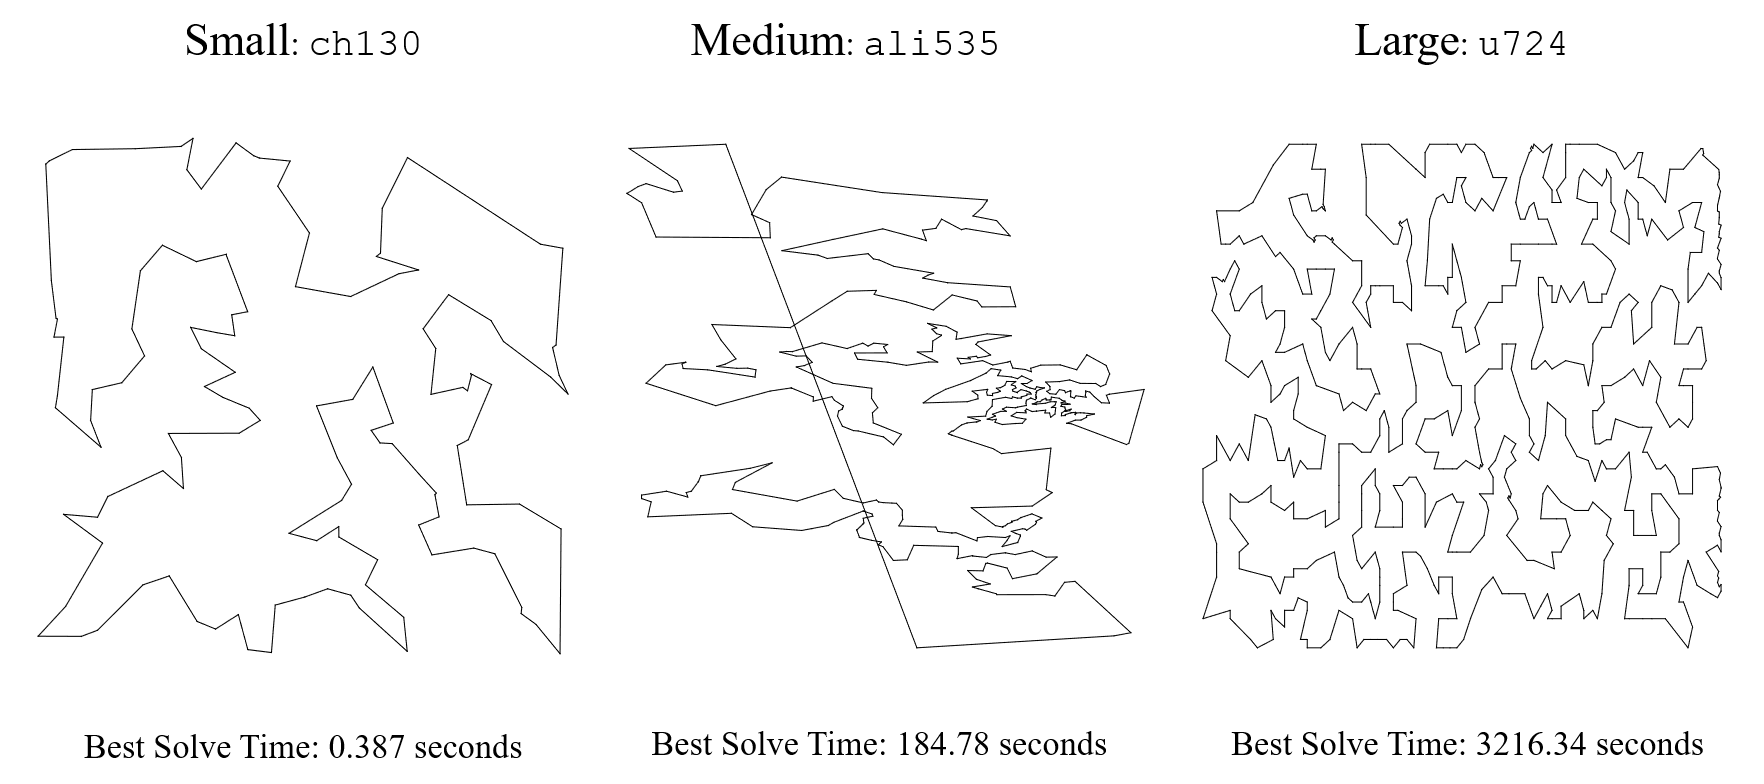
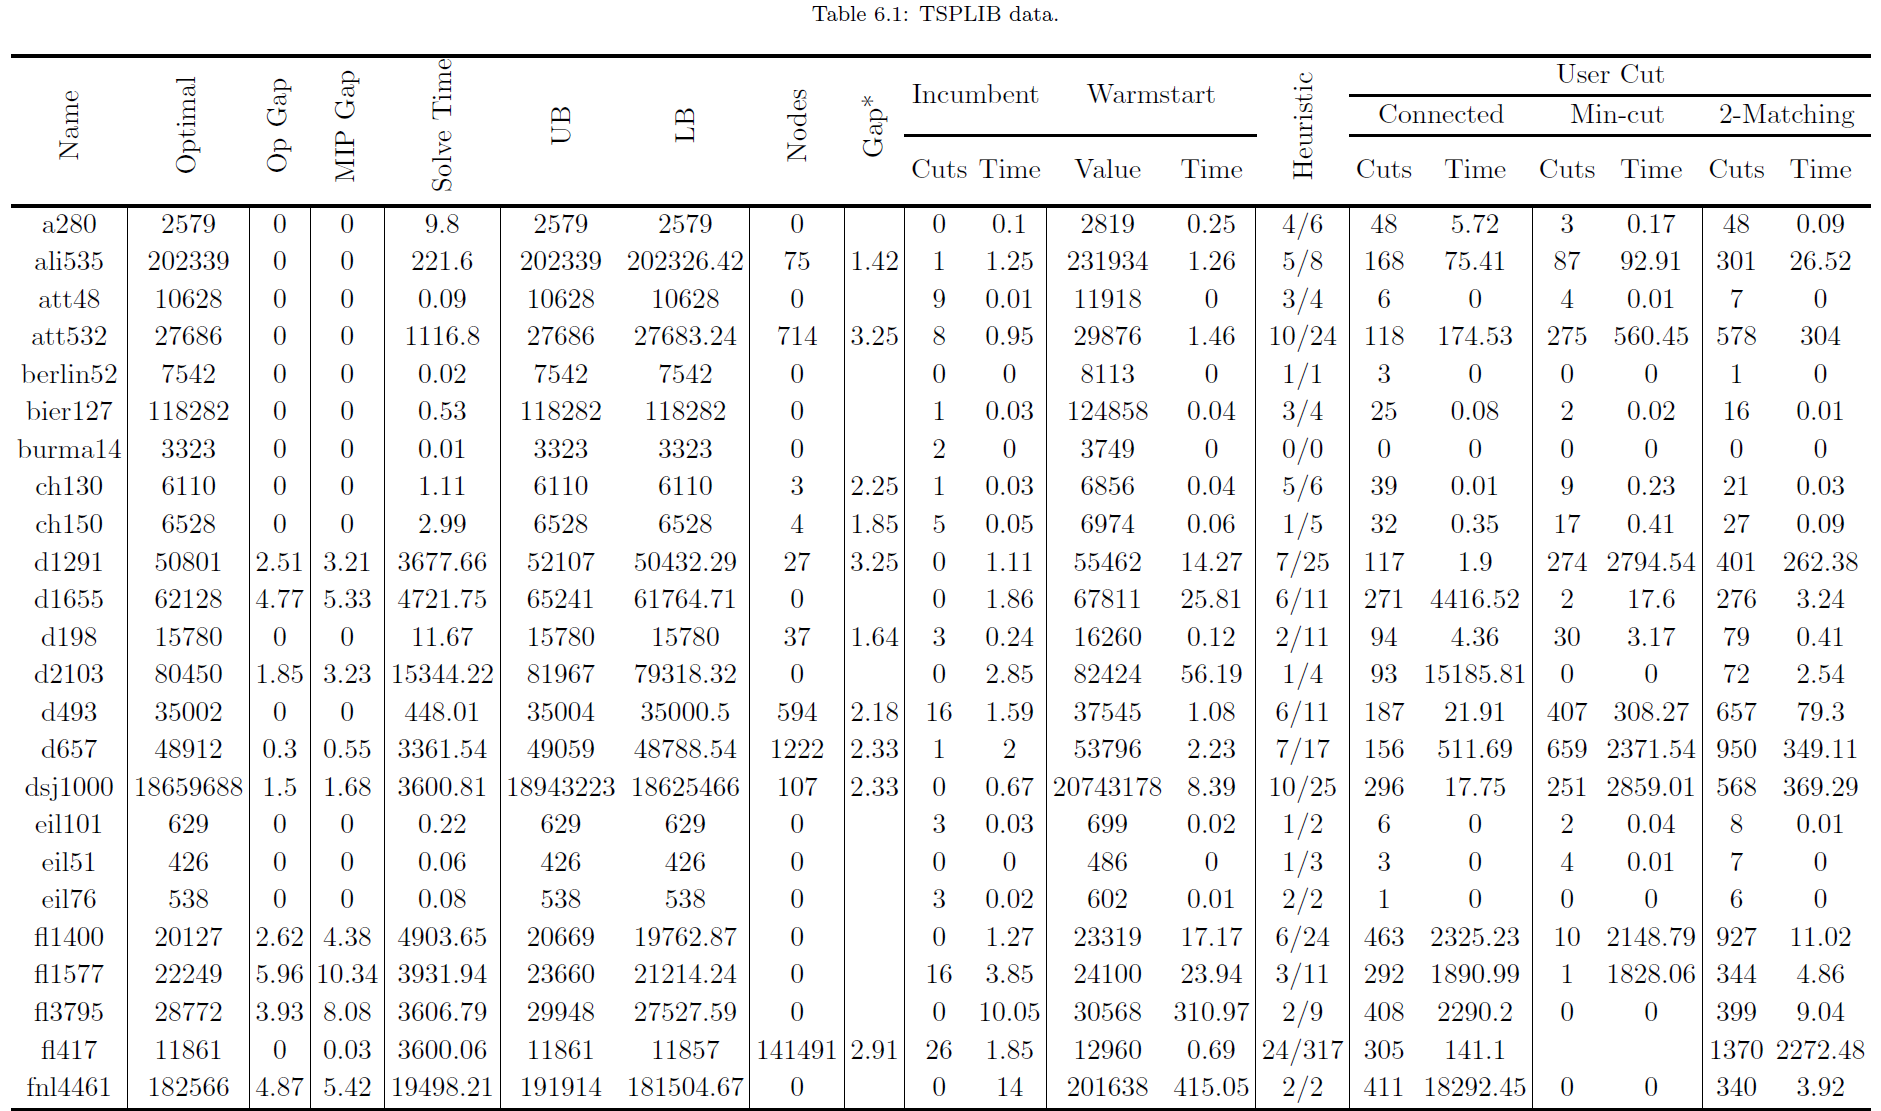
Results: The implementations led to significant improvements in solve time TSP instances with more than 200 nodes. Smaller TSP instances are fairly well solvable using the core branch and cut algorithm; thus the augmentations slowed these instances down (however with solve times of under 2 seconds the difference is practically insignificant).
There is an average of 84.58% improvement in solve time of the medium and large TSP instances from adding all of our augmentations simultaneously and 60% improvement in the solution quality for larger TSP instances which did not solve to optimality. This suggests that our augmentations were indeed successful.
Notable observations from the data:
- Warm-start ineffective when also implementing heuristic callback
- The pairing of two matching and connected components leads to terrible solution attempts; specifically worse than adding no implementations at all
We ran the full implementation suite with a 1-hour time-limit on a set of 89 problems from the TSPLIB
- This was all problems that our machine had enough memory to load in:
- The key observation from this data is that all instances on a specific node size are not equal
Machine learning approaches for super-resolution problems
Code: Machine learning approaches for super-resolution problems
Report: ML_Approaches_for_Super_Resolution_Problems_Report.pdf
Goal: To investigate the feasibility of generating high-resolution satellite images from lower-resolution inputs by integrating machine learning techniques using python.
Description: The project centered on analyzing Synthetic Aperture Radar (SAR) satellite imagery data from Sentinel-1 and Capella Space, specifically within the 2023 Turkey–Syria earthquakes region.
The metadata from SAR satellite imagery includes information about the imaging parameters (radiometric resolution, corrdinate reference system, radiometric accuracy) and acquisition conditions (orbit information, sensor configuration, swath width).
The project invoved loading the data, cleaning and preprocessing it by applying Geographic Information Systems (GIS) tools like Quantum GIS. Tasks included refining image quality through noise removal, radiometric calibration, and speckle filtering processes.
Mathematical concepts such as bilinear interpolation and entropy comparison were employed for proper image resizing and pixel alignment. Alternative approach for bilinear interpolation method was also implemented: the deep learning model - Enhanced Deep Residual Networks for Single Image Super-Resolution (EDSRx2) model.
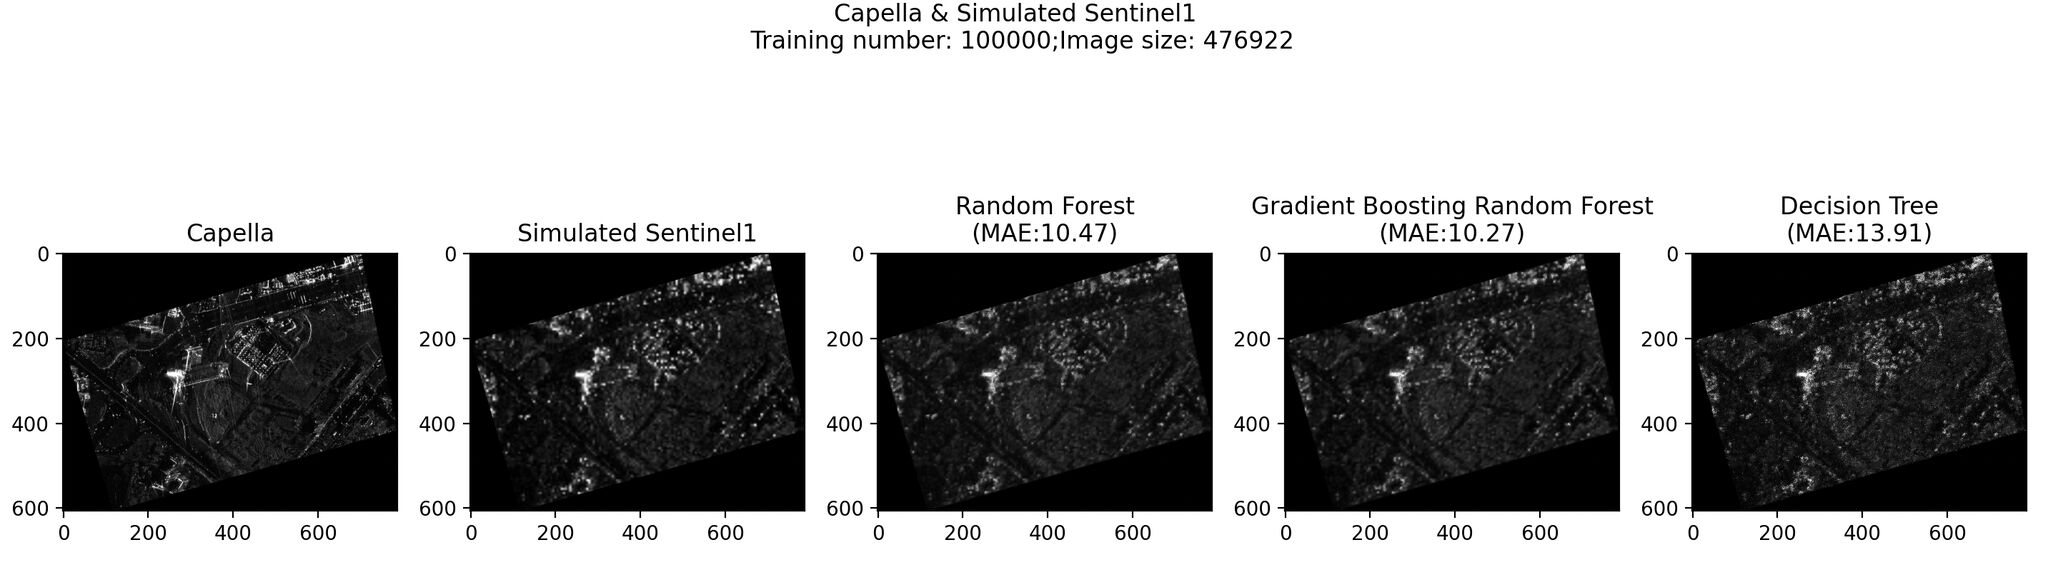
Machine learning models (Random Forest, Gradient Boosting, Decision Tree) were selected to perform image upscaling. Models were further enhanced through multidimensional feature vectors and Principal Component Analysis. Feature vectors includes surrounding pixel values, RGBI band pixel values from Sentinel-2, calculation of GNDVI, NDVI, and Building index, and integration of building layer from OpenStreetMap.
Skills: data preprocessing, machine learning, deep learning.
Technology: Python (skimage, matplotlib, rasterio, numpy, scipy, PyTorch).
Results: The investigation reveals challenges due to limited high-resolution SAR images like Capella’s.Super resolution methods were relied to upscale low-resolution data, which hinges on their effectiveness. Access to more high-resolution SAR images tailored to specific regions could significantly enhance our results.
Approach pairing Sentinel-1 data with Capella data shows promise with its efficient use and initial positive outcomes, suggesting a need for further exploration and integration of tailored feature layers to improve model performance.
.jpg)
.jpg)
Machine Learning Explorer Application (MLx.m)
Code: The project code is restricted from public access due to its status as an educational application currently in development. It is designated for private use within the university under the oversight of the professor.
Goal: To integrate a new data type (poker hands dataset) to the application; to create new App features by enabling accuracy and loss metrics, along with dynamic confusion chart for models training, testing and deploying automatically.
Description: The pokerhand dataset comprises thousands of entries, each representing a sequence of five playing cards characterized by their suit and rank values. The dataset includes attributes such as the suit and rank of each card, encoded numerically (1-4 for suits representing Hearts, Clubs, Diamonds, and Spades, and 1-13 for ranks representing Ace through King). Each entry ends with a class label ranging from 0 to 9, indicating the type of poker hand formed by the five cards, such as “Royal Flush” or “Two Pairs”.
The tasks include loading the dataset, visualizing its structure, developing feature selection algorithms, implementing normalization/scaling techniques, preprocessing the data for input into machine learning models, conducting model training and evaluation, optimizing parameters, and visualizing data insights.
Skills: Machine Learning, data preprocessing, data analysis, data visualization.
Technology: MATLAB (object-oriented coding, graphics and GUI toolbox, statistics and machine learning Toolbox)
Results: The Poker Hands dataset is successfully integrated, which expands the application’s functionality. This enhancement introduced automated computation of accuracy and loss metrics, providing detailed insights into model performance during training, testing, and deployment phases.
Additionally, the integration facilitated dynamic generation of confusion charts, enabling real-time visualization and analysis of classification results, thereby enhancing the application’s capability to evaluate and refine predictive models effectively.
/MLx app.png)
/confusion_chart.png)
Payment Fraud SQL Intelligence Platform
Code: Payment Fraud SQL Intelligence Platform
Goal: To build a production-style PostgreSQL risk analytics platform for payment fraud monitoring, merchant risk scoring, chargeback investigation, data quality testing, governance, and query performance optimization.
Description: This project models a realistic payment platform with customers, accounts, merchants, payment methods, device fingerprints, transactions, transaction events, fraud alerts, manual reviews, chargebacks, and audit logs. The database is designed to support both operational fraud workflows and analytics use cases, including alert triage, merchant monitoring, customer behavior analysis, and chargeback loss review.
The schema includes primary keys, foreign keys, business constraints, dashboard-ready views, materialized views, partial indexes, audit triggers, role-based access examples, and masked PII views. The SQL query layer implements fraud velocity checks, shared-device detection, country mismatch analysis, high-risk transaction scoring, merchant chargeback analytics, review queue ranking, customer activity cohorts, and operations dashboard metrics.
The project also includes data quality tests, transaction integrity tests, slow-query and optimized-query examples, and EXPLAIN-oriented performance documentation. This makes it a full SQL engineering case study rather than a simple query collection.
Skills: PostgreSQL database design, fraud analytics, data modeling, SQL performance tuning, CTEs, window functions, filtered aggregates, materialized views, indexes, audit triggers, RBAC, PII masking, data quality testing, transaction integrity testing.
Technology: PostgreSQL, SQL, Docker, Python CLI orchestration, materialized views, triggers, role-based security, EXPLAIN-based optimization.
Results:
- Designed a normalized payment fraud schema with operational and analytical layers.
- Built fraud detection queries for card velocity, device fan-out, country mismatch, high-risk transaction scoring, and review queue prioritization.
- Added governance features including audit logging, masked customer views, role-based access examples, and sensitive workflow controls.
- Created data quality and transaction integrity tests to catch relationship mismatches, invalid amounts, event ordering issues, and incomplete review workflows.
- Documented performance tuning patterns with slow-query and optimized-query versions using index-friendly predicates and materialized views.
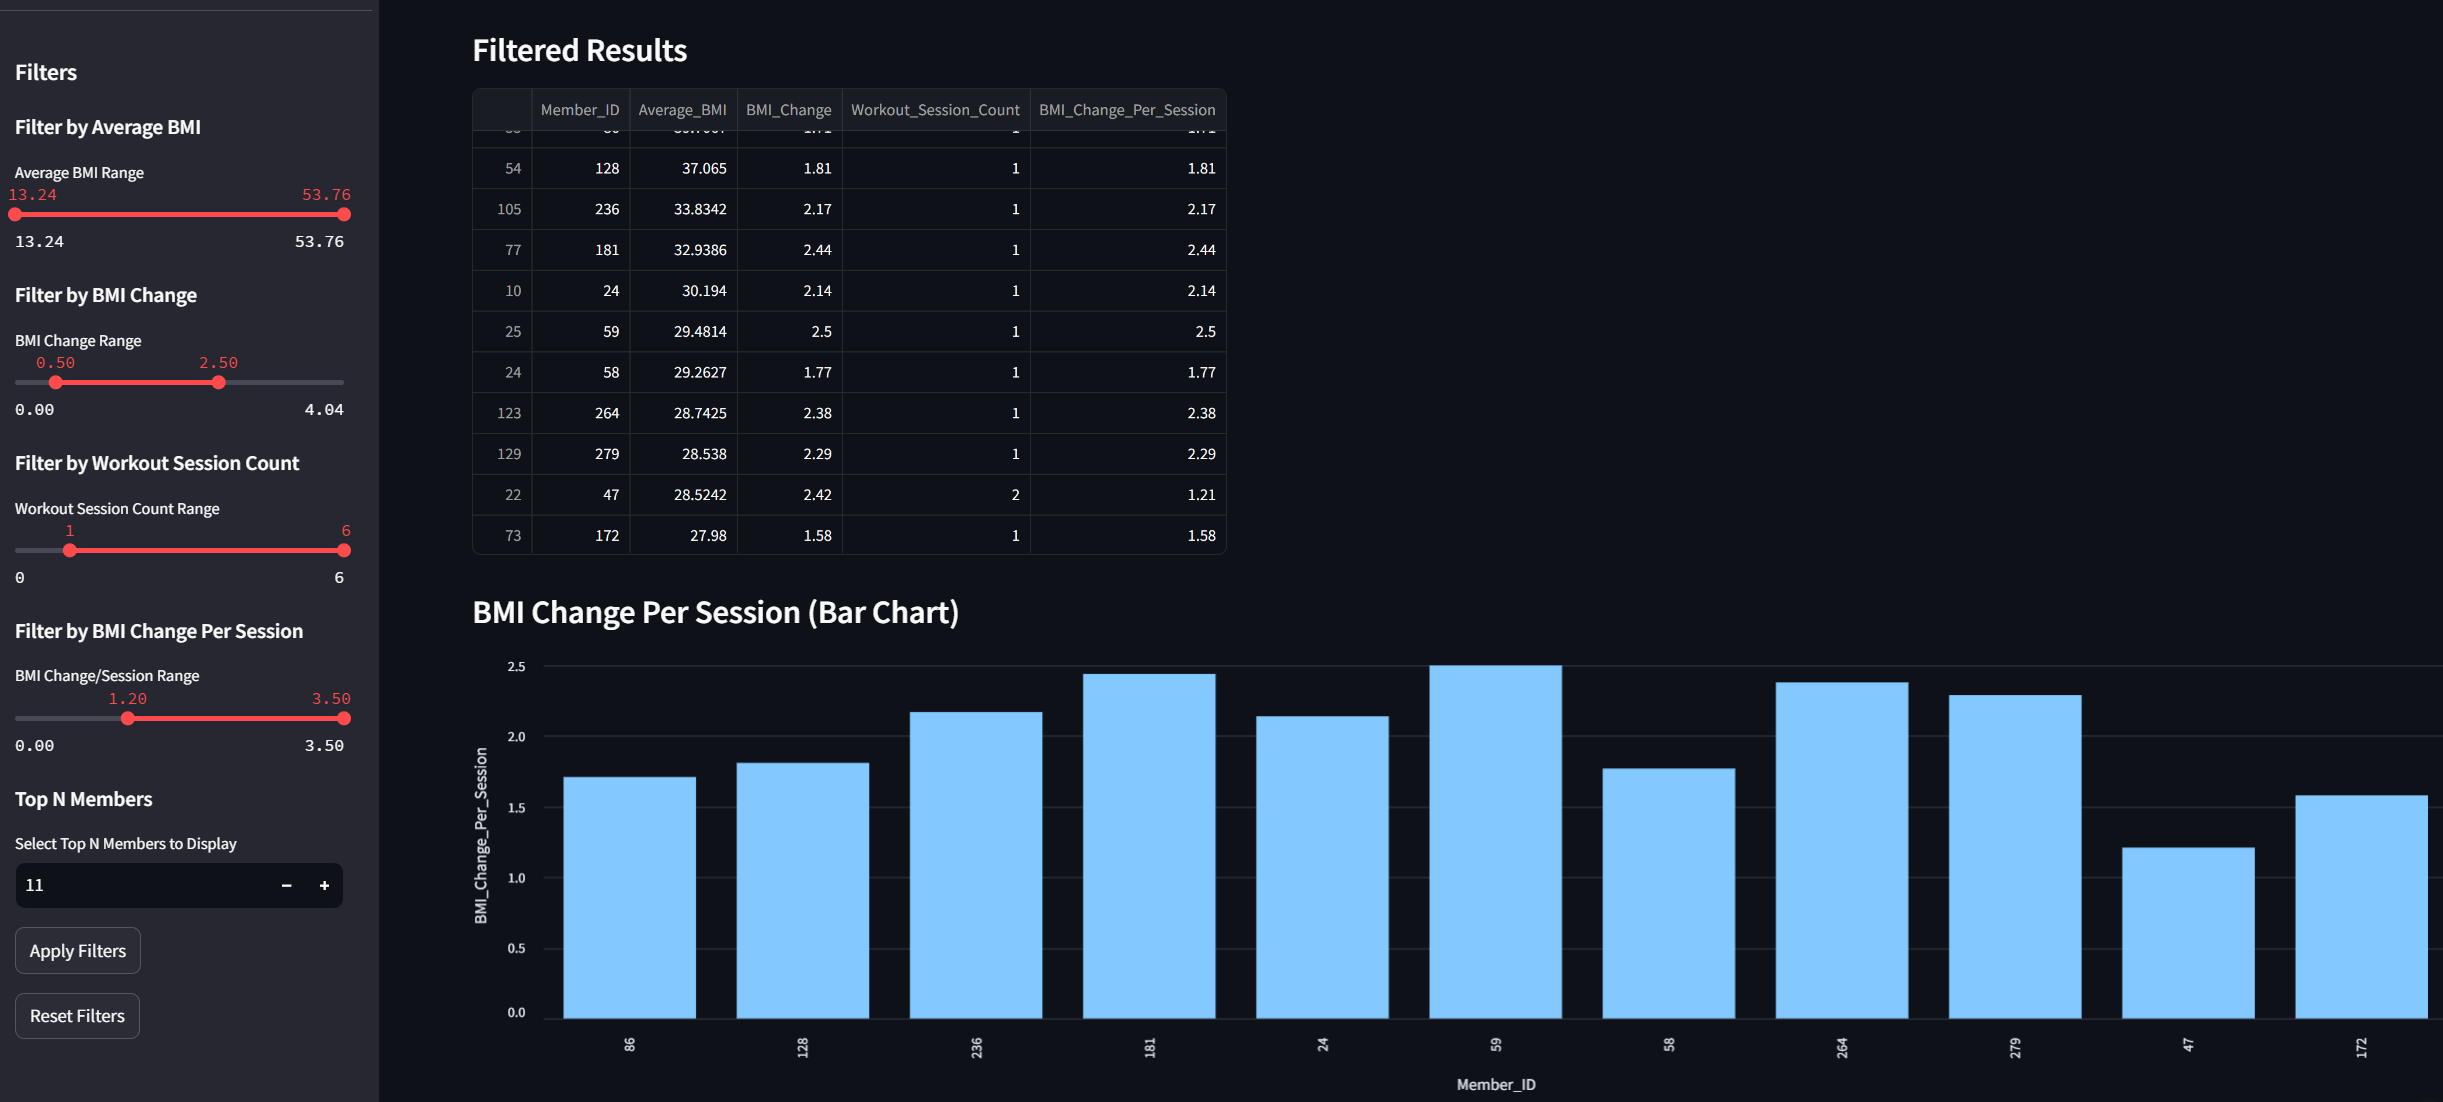
The EZ Trainer Database
Code: The EZ Trainer Database
Goal: To design and implement a comprehensive relational database for EZ Gym, integrating membership, operations, workout logging, and nutritional tracking, along with developing a VR-integrated fitness solution.
Description: The project involved developing a database system for EZ Gym, a fitness center that merges VR technology with personalized training experiences. The database supports various functions, including membership management, staff scheduling, and inventory management. Additionally, the system tracks workout and nutrition data for personalized health recommendations.
Skills: Database Design and Management, SQL Query Optimization, Data Analysis and Visualization, Integration of VR technology in fitness solutions
Technology: SQL for relational database management MongoDB for handling semi-structured data Python for data analysis and backend operations Jupyter Notebook for data manipulation and visualization
Results: Successfully implemented a scalable database that centralizes user information, simplifies administrative tasks, and supports advanced data analytics for personalized service delivery. Enhanced member engagement and operational efficiency were achieved through the integration of VR and detailed nutritional and workout tracking.
Dashboard: https://ez-training.streamlit.app/
Clinical Outcomes Causal Inference in R
Code: Clinical Outcomes Causal Inference in R
Goal: To build a reproducible R analytics project that estimates treatment effects from non-randomized clinical outcome data using causal inference methods, survival analysis, regression modeling, diagnostics, reporting, and an interactive dashboard.
Description: This project simulates an observational clinical study where treated and control patients differ in baseline severity, comorbidity, age, prior utilization, and hospital site. Because treatment assignment is not randomized, naive comparisons can be biased. The analysis uses propensity score modeling, nearest-neighbor matching, inverse probability weighting, covariate balance diagnostics, logistic regression, and Cox proportional hazards models to estimate adjusted treatment associations.
The project is structured as a reproducible R workflow rather than a one-off notebook. It includes synthetic data generation, data cleaning and validation functions, standardized mean difference balance checks, propensity score adjustment, survival modeling, Kaplan-Meier visualization, a Quarto report, a Shiny dashboard, a targets pipeline, an renv dependency pattern, and testthat tests for core data and model outputs.
Skills: R programming, causal inference, propensity score modeling, matching, inverse probability weighting, survival analysis, Cox regression, logistic regression, covariate balance diagnostics, reproducible research, statistical reporting, Shiny dashboard development, test-driven analytical workflows.
Technology: R, tidyverse, targets, renv, MatchIt, survival, broom, ggplot2, Quarto, Shiny, testthat.
Results:
- Built a synthetic clinical outcomes dataset with realistic confounding between treatment assignment and patient risk.
- Implemented reusable R functions for data validation, balance diagnostics, propensity score adjustment, outcome modeling, survival analysis, and visualization.
- Compared unadjusted, covariate-adjusted, matched, and weighted treatment effect estimates.
- Added Kaplan-Meier and Cox proportional hazards survival analysis for time-to-event outcomes.
- Packaged the workflow with a Quarto report, Shiny app, reproducible
targetspipeline, dependency lock pattern, and automated tests.
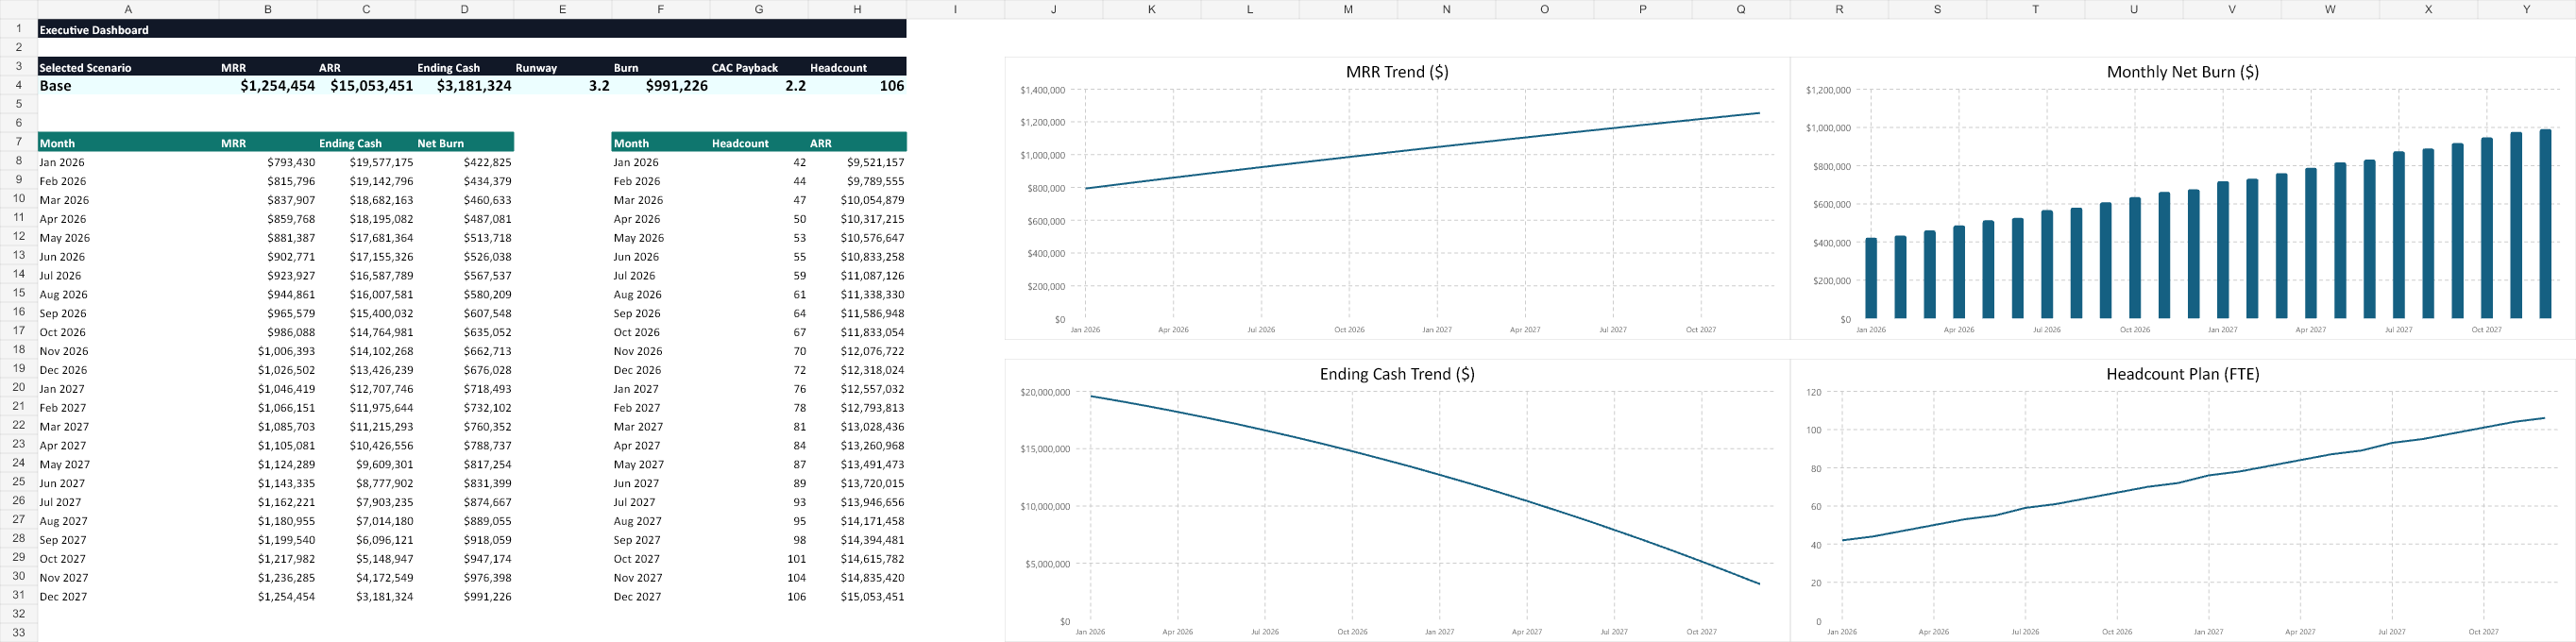
FP&A Scenario Planning Model in Excel
Code: FP&A Scenario Planning Model in Excel
Goal: To build an executive-ready SaaS FP&A workbook that forecasts revenue, expenses, cash flow, burn rate, runway, CAC payback, and key operating metrics under base, upside, and downside scenarios.
Description: This project creates a formula-driven Excel planning model for a SaaS company. The workbook separates inputs, assumptions, calculations, dashboard outputs, and validation checks so the model is easy to update, trace, and audit. Leadership can switch between base, upside, and downside cases to understand how growth, churn, acquisition spend, hiring, and operating expense assumptions affect MRR, ARR, gross profit, burn, ending cash, and runway.
The workbook includes source tabs for assumptions, historical actuals, and hiring plans; calculation tabs for revenue forecast, expense forecast, cash flow, and sensitivity analysis; and an executive dashboard with KPI cards and native Excel charts. A validation tab flags scenario selection issues, missing assumptions, customer roll-forward breaks, cash roll-forward breaks, and negative cash outcomes.
Skills: FP&A modeling, SaaS revenue forecasting, scenario planning, sensitivity analysis, cash runway modeling, financial dashboard design, Excel formulas, validation checks, workbook automation, stakeholder reporting.
Technology: Excel, JavaScript workbook automation, @oai/artifact-tool, CSV inputs, formula-driven model design, native Excel charts.
Results:
- Built a 24-month SaaS FP&A workbook with base, upside, and downside scenario controls.
- Modeled customer growth, churn, ARPA growth, MRR, ARR, NRR, CAC spend, headcount, payroll, opex, burn, cash flow, runway, and CAC payback.
- Added dashboard KPI cards and charts for MRR, ending cash, net burn, and headcount.
- Added validation checks to make model integrity visible to reviewers.
- Packaged source CSVs, methodology notes, generated workbook, dashboard screenshot, and reproducible build script.
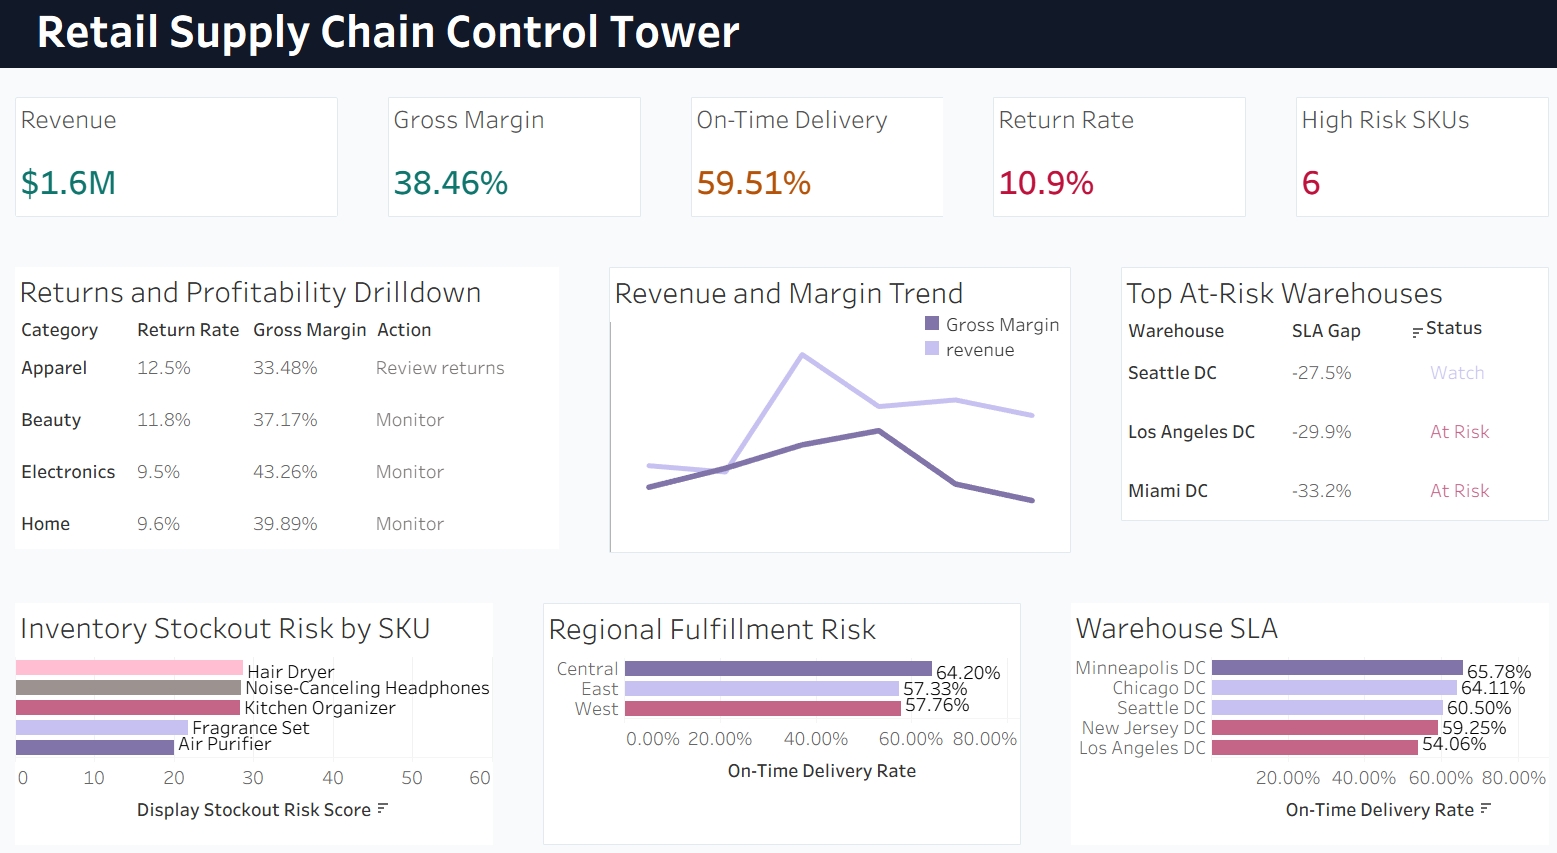
Retail Supply Chain Control Tower in Tableau
Code: Retail Supply Chain Control Tower in Tableau
Tableau Public: Retail Supply Chain Control Tower
Goal: To build a Tableau-ready retail supply chain control tower that monitors fulfillment SLA, warehouse bottlenecks, inventory risk, return rates, and SKU profitability.
Description: This project creates a BI-ready retail operations dataset and dashboard specification for Tableau Public. The data model combines orders, shipments, inventory, returns, and warehouse targets so operations leaders can move from executive KPI signals to region, warehouse, SKU, and order-level drilldowns.
The project includes calculated fields for revenue, gross margin, on-time delivery rate, late shipment rate, return rate, refund rate, fill rate, inventory days remaining, stockout risk score, SLA gap, and warehouse SLA status. It also includes LOD-style calculations for warehouse and SKU performance, a parameter-driven metric selector, a dashboard specification, and a step-by-step Tableau Public build guide.
Skills: Tableau dashboard design, BI data modeling, supply chain analytics, KPI design, calculated fields, LOD calculations, parameter controls, drilldown actions, operational analytics, executive reporting.
Technology: Tableau Public, CSV data model, Python synthetic data generation, Tableau calculated fields, dashboard actions, operational KPI design.
Results:
- Generated validated Tableau-ready CSVs for orders, shipments, inventory, returns, and warehouse targets.
- Designed an executive control tower dashboard for revenue, margin, SLA, returns, and inventory risk.
- Documented Tableau relationships, calculated fields, parameters, dashboard pages, and drilldown workflow.
- Published the Executive Overview dashboard to Tableau Public and packaged the supporting data/modeling assets for review.
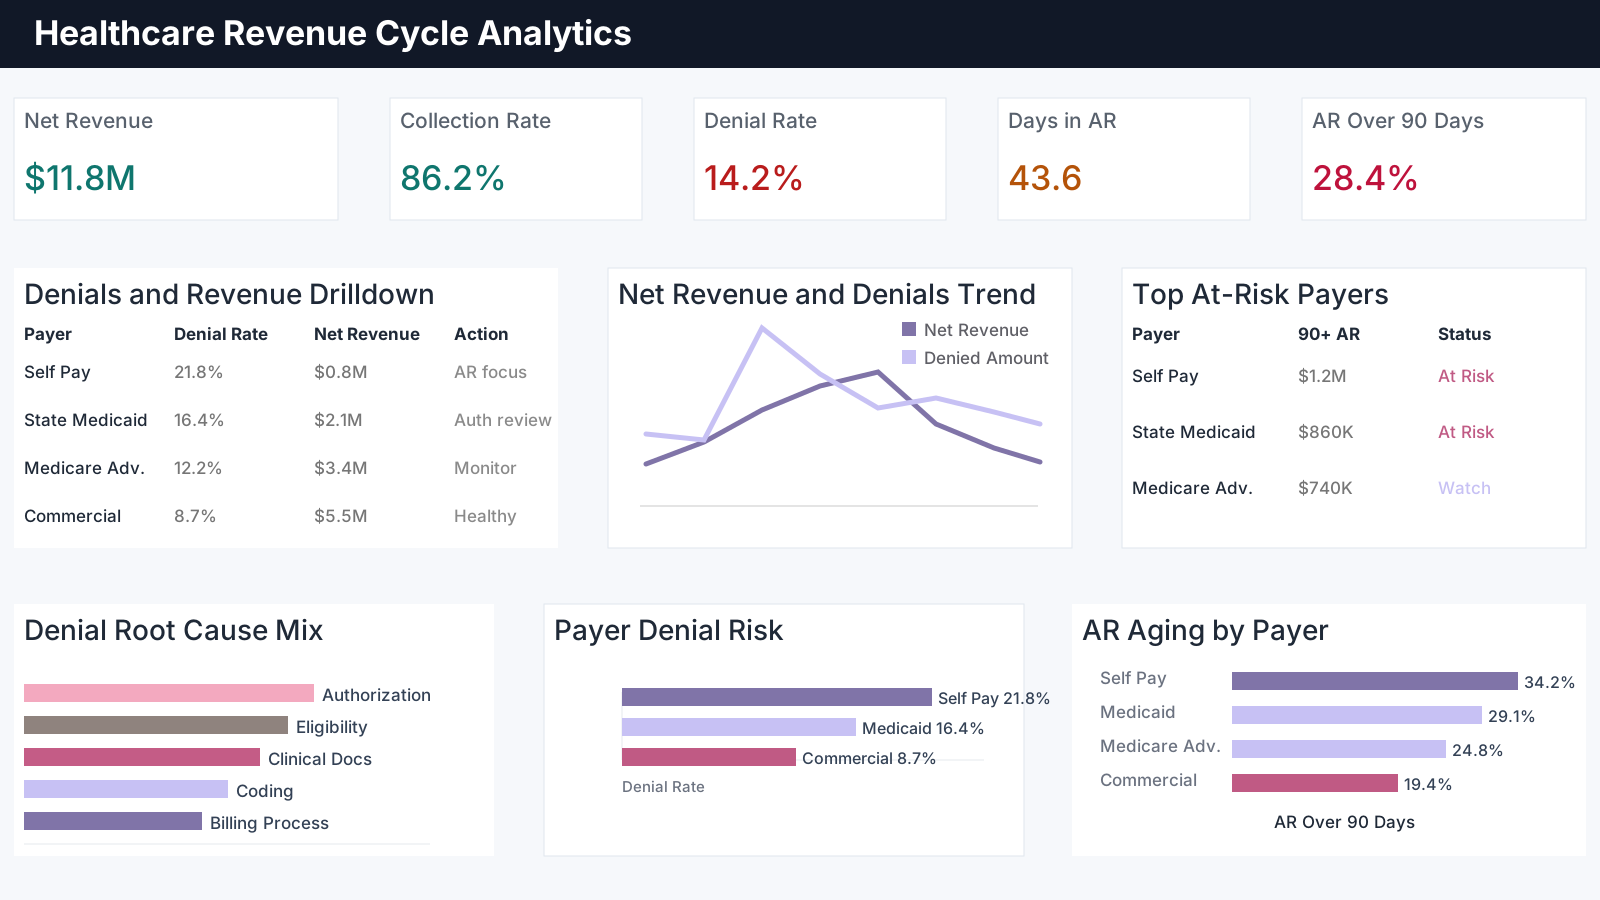
Healthcare Revenue Cycle Analytics in Power BI
Code: Healthcare Revenue Cycle Analytics in Power BI
Power BI Service: Pending publication.
Goal: To build a Power BI-ready healthcare revenue cycle analytics project that monitors net revenue, collection rate, denial rate, days in AR, payer risk, provider performance, and denial root causes.
Description: This project models a hospital revenue cycle operation using a governed Power BI semantic layer. The data model combines claims, payments, denials, accounts receivable snapshots, patients, providers, departments, payers, procedures, denial reasons, and a conformed date table. The report design lets finance and operations leaders move from executive KPIs into payer, department, provider, denial, AR aging, and claim-level drillthrough analysis.
The project includes Power Query cleanup instructions, a documented star schema, relationship mapping, a DAX measure table, dashboard specifications, row-level security roles, and validation scripts. The DAX layer covers gross charges, allowed amount, net revenue, collection rate, denial rate, preventable denied amount, clean claim rate, first-pass resolution rate, AR balance, AR over 90 days, days in AR, reimbursement lag, payer mix, YoY growth, and rolling three-month trends.
Skills: Power BI semantic modeling, DAX, Power Query, star schema design, healthcare revenue cycle analytics, KPI design, time intelligence, drillthrough pages, row-level security, data validation, executive dashboard design.
Technology: Power BI Desktop, Power Query, DAX, CSV data model, Python synthetic data generation, row-level security, healthcare finance analytics.
Results:
- Generated a validated healthcare revenue cycle dataset with 9,000 claims, 7,324 payments, 1,275 denials, and 2,062 AR snapshot rows.
- Designed a star-schema Power BI model with claims, payments, denials, AR snapshots, and conformed dimensions for payer, department, provider, procedure, patient, denial reason, and date.
- Built a DAX measure layer for revenue, collection, denials, AR aging, payment lag, payer mix, write-offs, and rolling trend analysis.
- Documented dashboard pages, drillthrough paths, Power Query steps, RLS roles, and portfolio publication workflow.
Certificates
- App Building Onramp
- MATLAB Onramp
- Machine Learning Onramp
- Object-Oriented Programming Onramp
- Data Analysis Using Python
- Operations Analytics
- Customer Analytics
- What is Data Science?
Contact
- LinkedIn: @emily-qiqiu
- Email: emily_qqiu@outlook.com